Performance Benchmarks
Every number on this page is produced by benchmarks, whose results are
committed to the repository. python -m benchmarks.run reproduces them, and
the docs build reads the committed CSVs rather than re-running anything.
The design
Thirty seeds over eight methods and ten dataset/model cells. Within a cell the calibrator is the only thing that varies: the out-of-fold scores and the test scores are computed once and shared, so a difference between two calibrators cannot be resampling noise. The test split is touched exactly once — nothing is selected, tuned or inspected on it.
Calibrators fit on out-of-fold scores from cross_val_predict, because a
model’s scores on its own training rows are already too good and a calibrator
fitted there learns the wrong correction.
Calibrators run at library defaults. Both SplineCalibrator and
NearlyIsotonicCalibrator select hyperparameters by internal
cross-validation. Defaults therefore have different tuning costs, included in
fit-and-transform time. Relaxed PAVA and CDI-ISO require application-specific
inputs and are excluded from this grid.
The logistic comparator fits scikit-learn logistic regression on log-odds; the
temperature comparator optimizes a scalar log-temperature directly. These are
not calls to CalibratedClassifierCV.
Everything that could be tuned to flatter calibre — datasets, seeds, model and
calibrator settings, the baseline, which metrics are primary — lives in
benchmarks/config.py, so the choices are visible in one diff.
Results
The overconfident design: a model reporting 1.8 * z for true log-odds
z. Lower Brier is better. “vs known truth” is available because the design is
synthetic, and it is the strongest evidence on the page. “Wins” counts seeds where
the method beat sklearn_isotonic on held-out Brier.
Method |
Brier |
dBrier |
smECE |
Distinct |
vs known truth |
Wins |
|---|---|---|---|---|---|---|
sklearn_platt |
0.1521 |
+0.0082 |
0.0251 |
1599 |
0.0064 |
26/30 |
sklearn_temperature |
0.1522 |
+0.0082 |
0.0251 |
1599 |
0.0040 |
26/30 |
calibre_spline |
0.1524 |
+0.0080 |
0.0263 |
1595 |
0.0175 |
28/30 |
calibre_centered |
0.1527 |
+0.0076 |
0.0284 |
1514 |
0.0205 |
25/30 |
calibre_isotonic |
0.1530 |
+0.0073 |
0.0270 |
49 |
0.0255 |
0/30 |
sklearn_isotonic |
0.1530 |
+0.0073 |
0.0270 |
49 |
0.0255 |
baseline |
calibre_nearly_isotonic |
0.1531 |
+0.0073 |
0.0270 |
52 |
0.0259 |
7/30 |
uncalibrated |
0.1604 |
– |
0.0835 |
1594 |
0.0808 |
0/30 |
Three things to read off it.
The Brier gains over isotonic are small. Centered isotonic and the spline keep around 1,500 distinct values instead of 49, at a Brier difference in the fourth decimal.
The parametric comparators have the lowest mean Brier scores in this design. Temperature scaling also estimates the known probabilities most accurately. Here the distortion is a pure temperature change, so the parametric family contains the inverse map. These results do not establish a general ranking.
smECE barely separates the methods, because it is a calibration measure and resolution is not miscalibration. No single number settles this comparison, which is why the page shows several and refuses to combine them.
What resolution actually looks like
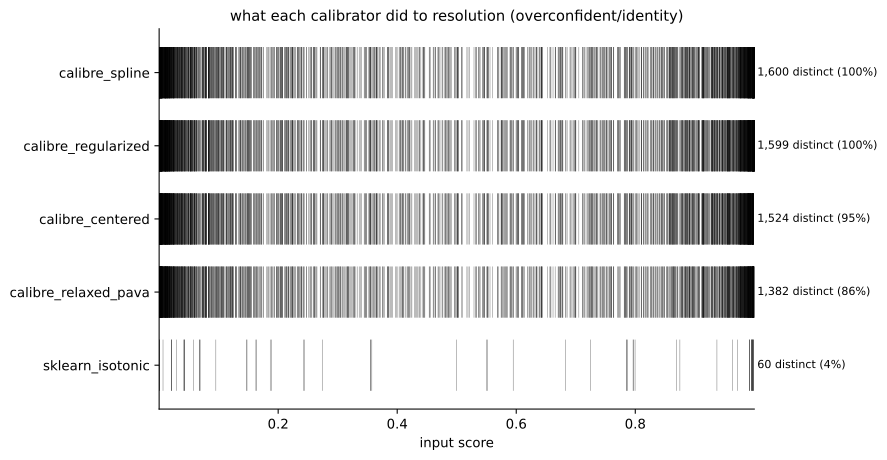
One thin tick per distinct output value, one strip per method, drawn across the input range. The number of ticks is the number of distinct values.
The score axis shows whether retaining more distinct values accompanies better held-out predictions in this design:
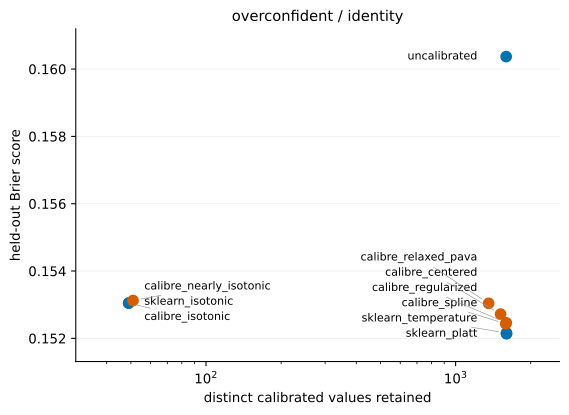
Centered isotonic and the spline retain more values with slightly lower mean Brier scores. This comparison does not identify the value of any particular extra distinction.
Paired differences against the baseline
Seed variance dwarfs the effect being measured, so levels would invite reading noise as a result. Differencing within a seed removes the dataset draw, the model fit and the split, leaving only the calibrator. The interval resamples seeds, because the seed is the unit of replication.
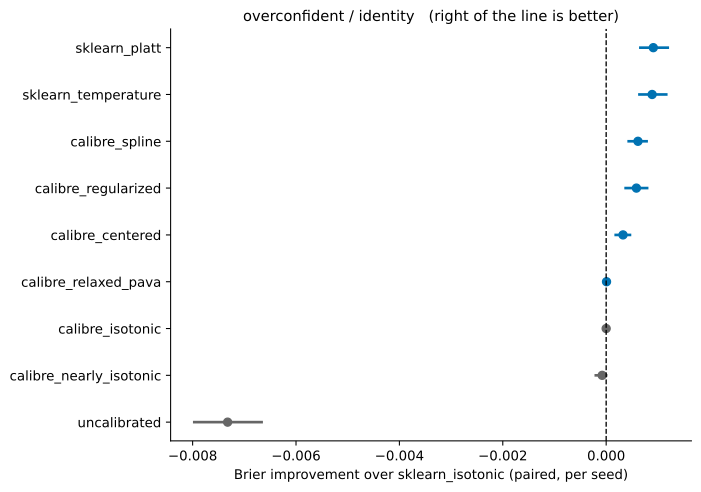
An interval that spans zero is drawn spanning zero. These are descriptive intervals without adjustment for multiple comparisons. On the real dataset they summarize repeated-split variability, not uncertainty across independent datasets.
Where calibre loses
Named rather than buried, because a benchmark that only reports wins is not a benchmark.
``overconfident`` — Platt and temperature scaling beat every calibre method, as above.
``breast_cancer/logreg`` — not calibrating at all beats isotonic by 0.0013 Brier, interval [0.0003, 0.0025], on 22 of 30 seeds. Logistic regression is already close to calibrated there and the test sample has about 228 rows, so pooling costs more than it buys.
``NearlyIsotonicCalibrator`` at its defaults is close to plain isotonic on these designs — 52 distinct values against 49. Its resolution frontier is dominated by centered isotonic regression, which reaches more distinct values at a better score, so no default was invented to hide this. See the class docstring.
nonmonotone was built expecting calibre to lose, since no monotone calibrator
can express a non-monotone truth. It did not: SplineCalibrator
scores 0.2156 against Platt’s 0.2224, because the parametric methods cannot follow
the dip either and give up more. That is what measuring is for.
What keeps it honest
Guards, not promises. Each of these fails loudly:
calibre_isotonicmust reproducesklearn_isotonicto 1e-12 on every row. calibre’s wrapper is a thin layer over scikit-learn’s, so any divergence is a bug — and a benchmark that hid it would be reporting calibre’s advantage over its own baseline.aggregate.pyrefuses to summarize a cell missing any of its seeds, naming the offenders. A dataset that errored on half its seeds would otherwise be averaged over whatever survived.No composite score. Score and resolution stay on separate axes. Folding them into one number is where a thumb goes on the scale.
Figures are drawn through
calibre.plots, so a regression in the plotting layer breaks the benchmark build instead of quietly producing a wrong picture here.
netcal is optional and off by default, enabled with --include-netcal. It is
not a hard dependency: the moment it lags a Python release, a required import
would make the whole harness un-runnable — which silently stops the benchmark
being re-run, the failure this design exists to prevent.